 by
by Sieve analysis of aggregate is a laboratory test used to determine the particle-size distribution or grading of fine and coarse aggregate. The test measures the percentage retained and percentage passing through a series of standard sieves and helps evaluate aggregate grading, fineness modulus and suitability for concrete production.
Sieve analysis is one of the most important laboratory tests used to determine the particle-size distribution or grading of aggregate.
In concrete technology, aggregates contain particles of different sizes. The proportion in which these sizes are present affects particle packing, void content, workability, paste requirement, segregation tendency and the overall performance of concrete.
During a sieve analysis, a representative aggregate sample is passed through a series of standard sieves arranged from the largest opening at the top to progressively smaller openings below. The mass retained on each sieve is measured and used to calculate the percentage retained, cumulative percentage retained and percentage passing.
The resulting particle-size distribution can then be compared with the applicable grading requirements for the intended use.
For aggregates used in concrete in India, sieve analysis is carried out with reference to IS 2386 (Part 1), while grading requirements for concrete aggregates are specified in IS 383.
Disclaimer: This article is intended for educational and practical laboratory guidance. Always verify the latest applicable Indian Standards, amendments, approved project specifications and laboratory quality procedures before carrying out acceptance testing.

Page Contents
What Is Sieve Analysis of Aggregate?
Sieve analysis is a test used to separate an aggregate sample into different particle-size fractions by passing it through sieves having progressively smaller openings.
The mass of material retained on each sieve indicates how much aggregate falls within a particular size range.
From these measurements, the following can be calculated:
- percentage retained on each sieve;
- cumulative percentage retained;
- percentage passing each sieve;
- particle-size distribution;
- aggregate grading; and
- fineness modulus where required.
The result provides a quantitative description of the distribution of particle sizes present in the sample.
What Is Particle-Size Distribution?
Particle-size distribution refers to the proportion of different particle sizes contained within an aggregate sample.
For example, a fine aggregate sample may contain particles retained on the:
- 4.75 mm sieve;
- 2.36 mm sieve;
- 1.18 mm sieve;
- 600 µm sieve;
- 300 µm sieve;
- 150 µm sieve; and
- pan.
The percentage of material passing each sieve describes the grading of the aggregate.
A well-controlled grading normally contains an appropriate distribution of different particle sizes rather than an excessive concentration in only one fraction.
Why Is Sieve Analysis Important?
Aggregate grading has a major influence on concrete production.
Sieve analysis helps engineers and laboratory personnel evaluate whether the aggregate contains the required distribution of particle sizes.
Proper grading can contribute to:
- efficient particle packing;
- control of aggregate voids;
- workable concrete;
- economical paste requirement;
- reduced tendency for segregation;
- consistent concrete production;
- appropriate pumpability and finishability; and
- better control of concrete mix proportions.
However, grading alone does not determine aggregate quality.
Other properties such as particle shape, strength, water absorption, specific gravity, cleanliness and durability must also be considered.
Fine Aggregate and Coarse Aggregate
For concrete aggregate terminology, the 4.75 mm sieve is an important dividing sieve.
Fine aggregate consists predominantly of particles passing the 4.75 mm sieve, subject to the applicable grading specification.
Coarse aggregate consists predominantly of particles retained on the 4.75 mm sieve.
Some aggregate supplies contain both coarse and fine fractions and may be treated as all-in aggregate or mixed aggregate for grading purposes.
Applicable Indian Standards
The principal standards relevant to aggregate sieve analysis include:
| Standard | Application |
|---|---|
| IS 2386 (Part 1):1963 | Methods of test for aggregates for concrete — particle size and shape |
| IS 383:2016 | Specification for coarse and fine aggregate for concrete |
| IS 2430:1986 | Sampling of aggregates for concrete |
| IS 460 (Part 1):2020 | Wire-cloth test sieves |
Standards may be amended or revised. The latest BIS status should therefore be checked before use.
Principle of the Sieve Analysis Test
The test is based on separating aggregate particles according to size.
A representative sample is placed on the largest sieve in a selected sieve series.
During sieving:
- particles smaller than an opening pass through that sieve;
- larger particles remain on the sieve;
- progressively smaller particles continue through the lower sieves.
After sieving is complete, the material retained on each sieve is weighed.
The total retained mass should be checked against the original test-sample mass to identify significant material loss during testing.
Apparatus Required
The usual apparatus includes:
- standard IS test sieves;
- sieve pan;
- sieve lid or cover;
- mechanical sieve shaker where available;
- weighing balance of suitable capacity and accuracy;
- laboratory oven where drying is required;
- trays or containers;
- sample divider or equipment for representative sample reduction;
- soft brush suitable for cleaning sieves; and
- record sheet or laboratory worksheet.
The sieves should be clean, undamaged and suitable for the aggregate being tested.
Standard Sieves Used for Aggregate Testing
IS 2386 (Part 1) identifies a series of sieves for aggregate analysis including coarse sieve sizes such as 80, 63, 50, 40, 31.5, 25, 20, 16, 12.5, 10, 6.3 and 4.75 mm, together with finer sieve sizes including 3.35, 2.36, 1.18 mm, 600 µm, 300 µm, 150 µm and 75 µm. The actual sieve combination selected depends on the aggregate type and grading being evaluated.
For a routine fine-aggregate grading test, a commonly used series is:
4.75 mm → 2.36 mm → 1.18 mm → 600 µm → 300 µm → 150 µm → pan
The required sieve series for coarse aggregate depends on its nominal size and the specification against which it is being assessed.
Representative Sampling
A correct sieve analysis begins with a representative sample.
A large stockpile can contain segregation, with larger particles accumulating in some locations and finer material in others.
Taking material only from the surface or from a single location can therefore give a misleading grading result.
The field or bulk sample should be obtained using the appropriate sampling procedure and then reduced carefully to the test quantity using a sample divider, quartering method or other approved technique.
IS 2430 is the relevant Indian Standard for sampling aggregates for concrete.
Minimum Sample Quantity for Sieve Analysis
IS 2386 (Part 1) specifies minimum test-sample masses related to the maximum aggregate size present in substantial proportion.
A useful laboratory reference is:
| Maximum size present | Minimum sample mass for sieving |
|---|---|
| 63 mm | 50 kg |
| 50 mm | 35 kg |
| 40 or 31.5 mm | 15 kg |
| 25 mm | 5 kg |
| 20 or 16 mm | 2 kg |
| 12.5 mm | 1 kg |
| 10 mm | 0.5 kg |
| 6.3 mm | 0.2 kg |
| 4.75 mm | 0.2 kg |
| 2.36 mm | 0.1 kg |
These are minimum test quantities from the test standard; project procedures may require larger representative samples before reduction.
Preparation of the Aggregate Sample
The aggregate should first be reduced to the required representative test quantity.
The sample is brought to an air-dry condition before weighing and sieving.
IS 2386 (Part 1) permits this condition to be achieved by drying at room temperature or by heating at approximately 100°C to 110°C.
After drying:
- allow the sample to reach a suitable handling condition;
- record the initial test-sample mass;
- check that the required sieves are clean;
- arrange the sieves from largest opening at the top to smallest opening at the bottom; and
- place a receiving pan beneath the smallest sieve.
Sieve Arrangement
The largest required sieve is placed at the top.
The openings then decrease progressively downward.
For fine aggregate, an example arrangement is:
4.75 mm
↓
2.36 mm
↓
1.18 mm
↓
600 µm
↓
300 µm
↓
150 µm
↓
Pan
The exact sequence should be selected according to the aggregate and specification being checked.
Test Procedure
Take the representative aggregate sample and bring it to the required dry condition.
Determine and record the total sample mass as:
W
Arrange the selected sieves in descending order of aperture size.
Place the aggregate on the uppermost sieve.
Fit the lid where a sieve nest is being used.
Sieve the aggregate carefully so that all particles have an adequate opportunity to pass through the appropriate openings.
Where individual sieves are shaken manually, IS 2386 specifies continued varied shaking and a minimum period of two minutes for each sieve while ensuring that the sieving is complete.
Where a mechanical sieve shaker and a nest of sieves are used, the standard notes that not less than 10 minutes of machine sieving is required for each test.
Particles should not be forced through a sieve by hand pressure.
After sieving is complete, carefully collect and weigh the aggregate retained on each sieve.
Include any particles carefully removed from the sieve mesh with the mass retained on that sieve.
Record all masses.
The standard also cautions against overloading sieves because excessive retained material can prevent particles from reaching the sieve openings efficiently.
Observation Table
A practical laboratory datasheet can be prepared as follows:
| Sieve size | Mass retained, g | % retained | Cumulative % retained | % passing |
|---|---|---|---|---|
| 4.75 mm | ||||
| 2.36 mm | ||||
| 1.18 mm | ||||
| 600 µm | ||||
| 300 µm | ||||
| 150 µm | ||||
| Pan | — |
Additional or different sieve sizes should be included when required.
Calculation of Percentage Retained
Let:
W = total original sample mass
and
w = mass retained on a particular sieve
Then:
Percentage retained = (w ÷ W) × 100
Example
If:
Total sample mass = 1000 g
Mass retained on the 1.18 mm sieve = 160 g
Then:
Percentage retained = (160 ÷ 1000) × 100
= 16%
Cumulative Percentage Retained
Cumulative percentage retained is obtained by adding the percentage retained on the current sieve to all percentages retained on larger sieves above it.
For example:
If percentage retained is:
- 4.75 mm = 2%
- 2.36 mm = 8%
- 1.18 mm = 16%
then cumulative retained on the 1.18 mm sieve is:
2 + 8 + 16 = 26%
Percentage Passing
Percentage passing represents the fraction of the total aggregate sample smaller than the opening of a particular sieve.
It is calculated as:
Percentage passing = 100 − Cumulative percentage retained
If cumulative percentage retained on the 1.18 mm sieve is 26%:
Percentage passing = 100 − 26
= 74%
IS 2386 permits sieve-analysis results to be reported as cumulative percentage passing each sieve or as the percentage falling between successive sieves; cumulative percentage passing is particularly useful when comparing the result with grading specifications.
Worked Example of Fine Aggregate Sieve Analysis
Consider a 1000 g fine aggregate sample.
Assume the following masses are obtained:
| Sieve | Mass retained (g) |
|---|---|
| 4.75 mm | 20 |
| 2.36 mm | 80 |
| 1.18 mm | 160 |
| 600 µm | 260 |
| 300 µm | 280 |
| 150 µm | 160 |
| Pan | 40 |
| Total | 1000 |
The calculations become:
| Sieve | Mass retained (g) | % retained | Cumulative % retained | % passing |
|---|---|---|---|---|
| 4.75 mm | 20 | 2 | 2 | 98 |
| 2.36 mm | 80 | 8 | 10 | 90 |
| 1.18 mm | 160 | 16 | 26 | 74 |
| 600 µm | 260 | 26 | 52 | 48 |
| 300 µm | 280 | 28 | 80 | 20 |
| 150 µm | 160 | 16 | 96 | 4 |
| Pan | 40 | 4 | 100 | 0 |
This distribution can then be compared with the appropriate fine-aggregate grading requirements in IS 383.
For this illustrative dataset, the percentage-passing values correspond to the general pattern of Grading Zone II fine aggregate.
The final grading classification should always be made against the latest applicable specification rather than from fineness modulus alone.
Fineness Modulus of Fine Aggregate
Fineness modulus, commonly abbreviated as FM, is an index representing the overall coarseness or fineness of an aggregate grading.
For a conventional fine-aggregate calculation, the cumulative percentages retained on the selected standard sieve series are added and divided by 100.
Fineness Modulus = Sum of cumulative % retained on specified sieves ÷ 100
Using the worked example:
Cumulative percentages retained on:
- 4.75 mm = 2
- 2.36 mm = 10
- 1.18 mm = 26
- 600 µm = 52
- 300 µm = 80
- 150 µm = 96
Therefore:
FM = (2 + 10 + 26 + 52 + 80 + 96) ÷ 100
FM = 266 ÷ 100
FM = 2.66
A higher fineness-modulus value generally indicates a coarser overall grading, while a lower value indicates a finer grading.
However:
Fineness modulus should not be used as a substitute for the complete sieve-analysis result.
Two aggregates can have similar fineness-modulus values while having different particle-size distributions.
The percentage passing individual sieves must therefore also be checked.
Grading Zones of Fine Aggregate
IS 383 classifies fine aggregate grading into four grading zones:
Zone I
Zone II
Zone III
Zone IV
These zones describe progressively different particle-size distributions.
The grading zone is determined by comparing the percentage passing the specified sieves against the limits given in the applicable version of IS 383.
The complete grading table from the current standard should be consulted for acceptance rather than relying on a simplified description.
IS 383:2016 remains the current listed aggregate specification and was reviewed by BIS in January 2026.
Sieve Analysis of Coarse Aggregate
The same general principle is applied to coarse aggregate, but larger sieves and larger sample quantities are required.
For example, the grading assessment of nominal 20 mm aggregate may involve sieves such as:
40 mm → 20 mm → 10 mm → 4.75 mm
The exact sieve series depends on whether the material is:
- single-size aggregate;
- graded aggregate;
- nominal 10 mm aggregate;
- nominal 20 mm aggregate;
- nominal 40 mm aggregate; or
- another specified grading.
The measured percentage passing should be compared directly with the applicable coarse-aggregate grading limits in IS 383 or the project specification.
What Is Nominal Maximum Aggregate Size?
Nominal maximum size should not simply be interpreted as the size of the largest individual stone found in a stockpile.
It relates to the grading designation of the aggregate and the sieve sizes controlling that grading.
For concrete production, aggregate nominal maximum size affects:
- concrete mix design;
- reinforcement congestion;
- minimum member dimensions;
- pumpability;
- placing;
- finishing; and
- aggregate proportions.
The specified aggregate size should therefore be consistent with the structural design and concrete mix requirements.
Sieve Analysis of All-in Aggregate
All-in aggregate contains both coarse and fine fractions.
When the complete sample is placed directly on a sieve nest, excessive amounts of fine material may overload the smaller sieves.
IS 2386 therefore recognizes that it may be necessary to separate the aggregate initially into coarse and fine portions using a convenient intermediate sieve, such as around the 4.75 mm range, and then test the fractions appropriately.
The final result is then combined to represent the grading of the original aggregate.
Particle-Size Distribution Curve
Sieve-analysis results can also be shown graphically.
A typical grading curve plots:
Horizontal axis: sieve aperture or particle size, normally on a logarithmic scale.
Vertical axis: cumulative percentage passing.
Each sieve result is plotted and the points are connected to form the grading curve.
IS 2386 specifically provides for graphical recording of cumulative percentage passing.
How to Interpret a Grading Curve
A grading curve helps visualize the distribution of particle sizes.
A smooth curve extending across several sieve sizes generally indicates that several particle fractions are present.
A steep curve concentrated over a small range suggests a more uniform or narrowly graded aggregate.
A sudden flattening or break may indicate that an intermediate fraction is comparatively deficient.
However, acceptance should always be based on the specified grading limits rather than visual appearance alone.
Difference Between Sieve Analysis and Fineness Modulus
| Sieve Analysis | Fineness Modulus |
|---|---|
| Gives complete particle-size distribution | Gives a single numerical index |
| Reports percentage passing/retained | Calculated from cumulative retained values |
| Used directly for specification comparison | Useful for overall grading comparison |
| Identifies missing or excessive size fractions | Does not show where grading variations occur |
| Essential grading test | Supplementary grading indicator |
Therefore, FM should never replace the sieve-analysis table or grading curve.
Sieve Analysis and Concrete Mix Design
Aggregate grading directly affects concrete mix proportioning.
When aggregate particles are distributed appropriately, smaller particles can occupy spaces between larger particles, although actual concrete packing also depends on particle shape, texture and proportioning.
Changes in grading can affect:
- water demand;
- workability;
- sand content;
- paste requirement;
- pump pressure;
- bleeding;
- segregation;
- finishing behaviour; and
- yield.
For this reason, large changes in aggregate grading should not be ignored during concrete production even when the source of aggregate remains unchanged.
This will become especially important in our upcoming Concrete Mix Design cluster.
Common Errors During Sieve Analysis
Common laboratory mistakes include:
- taking a non-representative sample;
- failing to dry the sample appropriately;
- using dirty or damaged sieves;
- arranging sieves incorrectly;
- overloading an individual sieve;
- inadequate shaking;
- forcing particles through the mesh;
- losing aggregate while transferring between sieves;
- leaving retained particles embedded in the sieve;
- incorrect weighing;
- calculation errors;
- mixing grams and kilograms;
- using the wrong original sample mass; and
- interpreting grading from fineness modulus alone.
Important Precautions
Use a representative aggregate sample.
Check the sieve openings and frames before the test.
Ensure sieves are clean.
Arrange sieves in the correct descending order.
Avoid overloading the sieve surface.
Do not force particles through the mesh.
Avoid excessive brushing that could damage fine sieve openings.
Carefully recover all retained aggregate.
Record the mass immediately.
Check the final total retained mass against the original sample mass.
Investigate any significant mass discrepancy before accepting the result.
Use the latest applicable grading specification when interpreting results.
Laboratory Mass Check
After completing the test:
Sum of masses retained on all sieves + pan ≈ original test-sample mass
A minor difference can occur because of normal handling or balance resolution, but an unexplained significant loss indicates that the test should be investigated.
Examples of possible causes are:
- aggregate spilled during transfer;
- fine material lost as dust;
- material remaining in trays;
- particles lodged in the sieve;
- incorrect balance reading; or
- transcription error.
The laboratory quality procedure should define the acceptable mass-balance tolerance.
Difference Between Sieve Analysis and Material Finer Than 75 Microns
These tests should not be confused.
Dry sieve analysis determines the overall particle-size distribution.
The test for material finer than 75 µm may require a washing procedure because very fine particles such as dust or clay-sized material can adhere to larger aggregate particles and may not be accurately determined by ordinary dry sieving.
IS 2386 (Part 1) includes a separate procedure for determination of material finer than the 75 µm sieve by washing.
Therefore, the amount passing 75 µm required for specification compliance should be determined using the appropriate test procedure where required.
Suggested Aggregate Sieve Analysis Test Report
A laboratory report should normally record:
Project:
Client:
Location:
Material: Fine / Coarse / All-in aggregate
Aggregate source:
Sample identification:
Date sampled:
Date tested:
Test method: IS 2386 (Part 1)
Specification: IS 383 / approved project specification
Original sample mass:
Sieve sizes:
Mass retained:
Percentage retained:
Cumulative percentage retained:
Percentage passing:
Fineness modulus, where applicable:
Grading classification:
Observations:
Tested by:
Checked by:
This format improves traceability and makes the result easier to review during QA/QC inspection.
Practical Site Example
Suppose a concrete batching plant receives a new delivery of fine aggregate.
The material comes from the same supplier, but the sand appears visibly finer than previous deliveries.
Rather than modifying the concrete water or admixture dosage immediately, the quality-control team should obtain a representative sample and carry out sieve analysis.
If the grading has shifted toward a finer distribution, the change may help explain increased water demand or changes in workability.
The engineer can then review:
- aggregate grading;
- moisture content;
- water absorption;
- mix-design assumptions; and
- trial-batch performance
before making controlled adjustments.
This demonstrates why sieve analysis is not merely a laboratory exercise—it is directly connected to practical concrete production.
Frequently Asked Questions
What is sieve analysis of aggregate?
Sieve analysis is a laboratory test used to determine the particle-size distribution of aggregate by separating a representative sample through a series of sieves with progressively smaller openings.
What is the IS code for sieve analysis of aggregate?
Sieve analysis of aggregates for concrete is covered by IS 2386 (Part 1):1963. Aggregate grading requirements for concrete are specified in IS 383:2016.
What is the purpose of sieve analysis?
The purpose is to determine how different particle sizes are distributed within an aggregate sample and to compare the resulting grading with the applicable specification.
What sieve separates fine and coarse aggregate?
The 4.75 mm sieve is the principal reference sieve used in distinguishing fine and coarse aggregate for concrete grading terminology.
What is percentage retained?
Percentage retained is the mass retained on a particular sieve expressed as a percentage of the original test-sample mass.
% retained = Mass retained ÷ Total sample mass × 100
What is cumulative percentage retained?
It is the total percentage retained on a particular sieve plus all larger sieves above it.
How is percentage passing calculated?
Percentage passing = 100 − Cumulative percentage retained
What is fineness modulus?
Fineness modulus is a numerical index calculated from cumulative percentages retained on a specified sieve series. It gives an overall indication of aggregate coarseness or fineness but does not replace the complete grading analysis.
What are the grading zones of fine aggregate?
Fine aggregate grading under IS 383 is categorized into Zones I, II, III and IV, based on percentage passing specified sieves.
Is a higher fineness modulus finer or coarser?
A higher fineness modulus generally indicates a coarser overall grading, while a lower fineness modulus indicates a finer grading.
Can sieve analysis alone determine aggregate quality?
No. Sieve analysis determines grading. Aggregate quality also depends on properties such as specific gravity, water absorption, particle shape, mechanical strength, cleanliness and durability.
Why should a representative sample be used?
Aggregate stockpiles can segregate according to particle size. A non-representative sample can therefore produce a grading result that does not reflect the actual aggregate supply.
Conclusion
Sieve analysis is a fundamental aggregate test used to determine the particle-size distribution of fine, coarse and mixed aggregates.
The test involves preparing a representative sample, passing it through a selected series of standard sieves, weighing the material retained on each sieve and calculating percentage retained, cumulative percentage retained and percentage passing.
These results allow engineers to:
- evaluate aggregate grading;
- determine the particle-size distribution;
- calculate fineness modulus where required;
- compare aggregate against applicable grading requirements;
- identify changes in supplied material; and
- support concrete mix design and quality-control decisions.
For reliable results, the most important requirements are representative sampling, correct sample preparation, suitable standard sieves, complete sieving, accurate weighing and correct interpretation against the applicable specification.
About T Square Civil Engineering
T Square Civil Engineering is a civil engineering learning platform created to support students, site engineers, QA/QC engineers, laboratory technicians, quantity surveyors, contractors and construction professionals with practical learning resources, worked examples and calculators that connect engineering theory with construction practice.
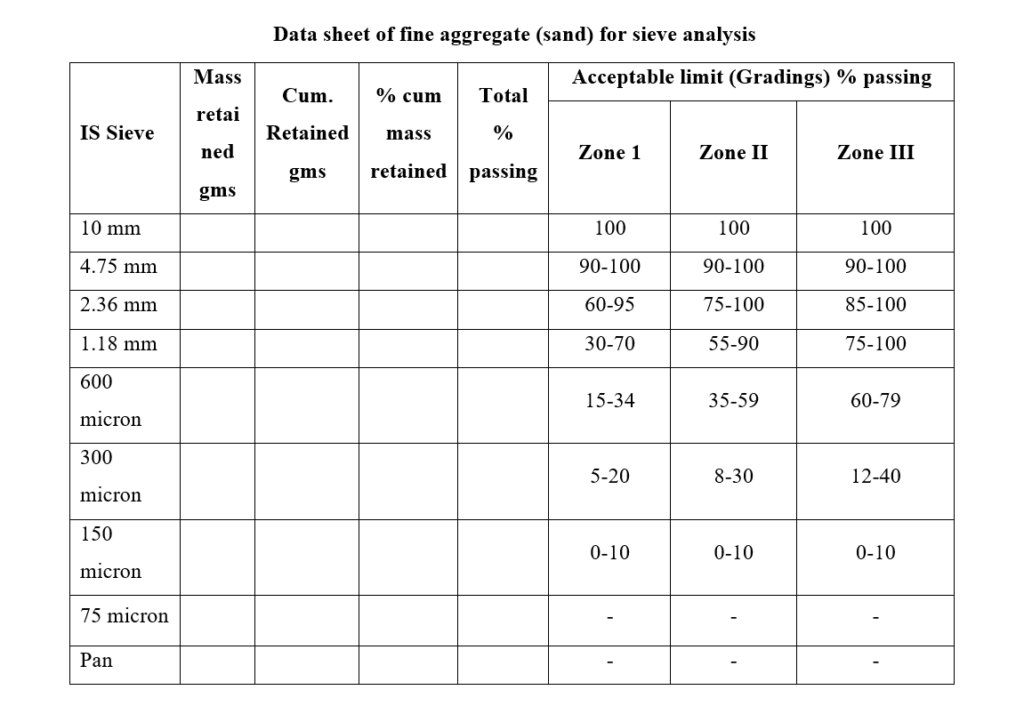
Datasheet of fine aggregate (sand) for sieve analysis
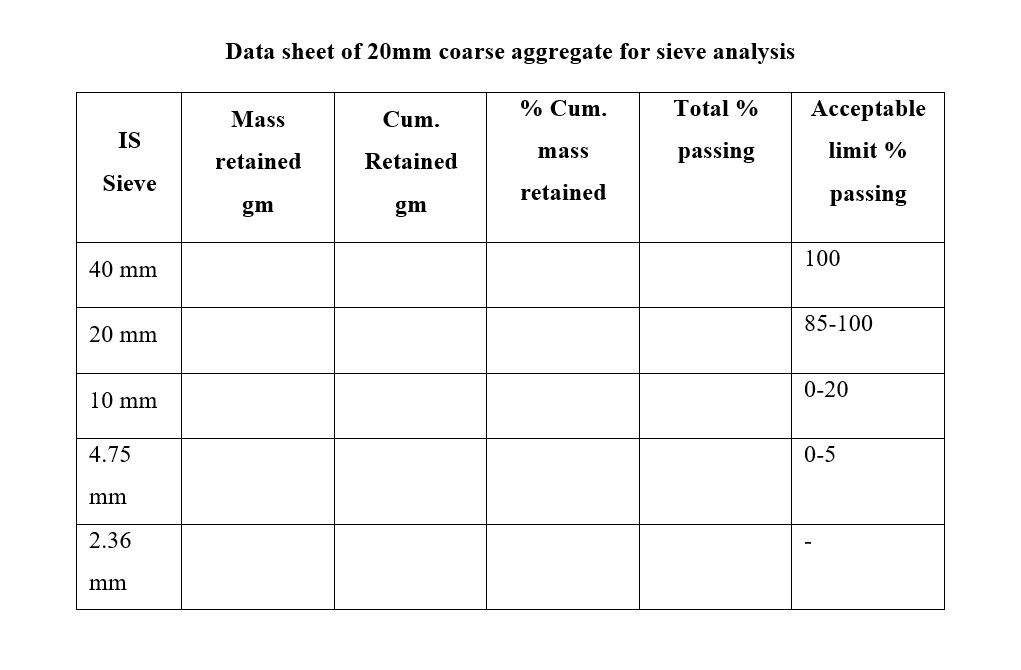
Datasheet of 20mm coarse aggregate for sieve analysis
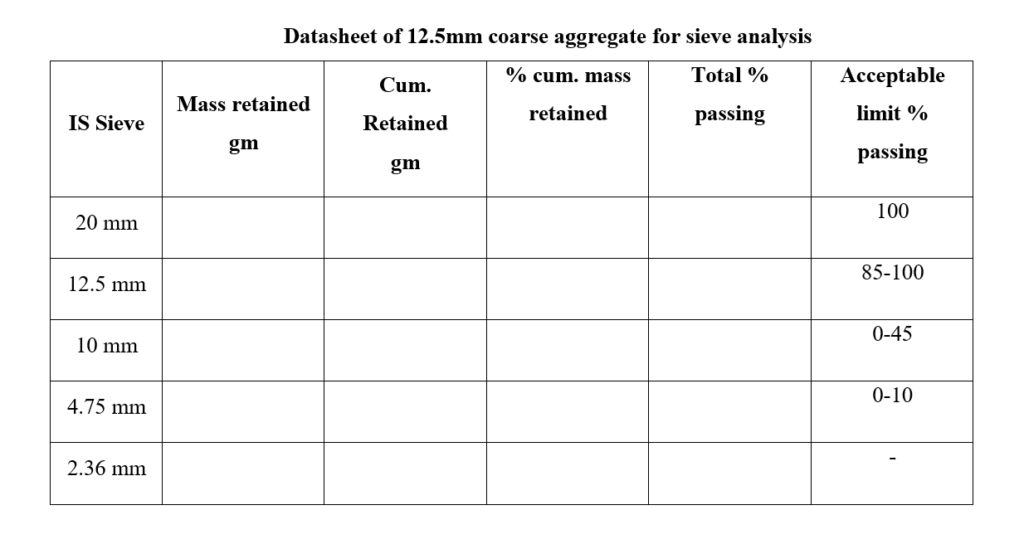
Datasheet of 12.5mm coarse aggregate for sieve analysis
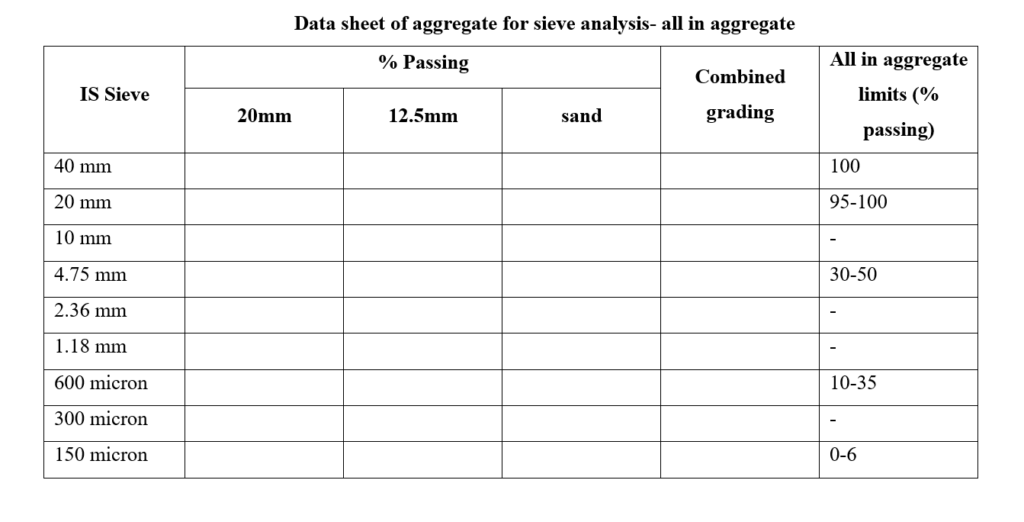
Datasheet of aggregate for sieve analysis- all in aggregate